Purpose: Assess horizontal explosiveness
Assessment Method: Two-leg broad jump measured by 1080 Sprint with waist belt.
We all know it—the ability of an athlete to jump high and fast significantly correlates to success across a wide range of sports actions (and if you don’t know it or don’t believe us, see Reiser et al 2006). Consequently, vertical movement patterns have been assessed under loaded conditions for a long time. However, this has not been the case with horizontal movement patterns. This is surprising considering that the ability to generate horizontal and vertical force, speed, and power represent different physical qualities. Thus, having the tools to precisely test, analyze, train, and monitor horizontal movement patterns under loaded conditions is important.
The Set-Up
Movement: Two-leg broad jump—a simple, discrete horizontal movement.
Measurement: Force, speed, and power, where peak velocity can be determined by creating a load-velocity profile using the 1080 Sprint.
Method: Different protocols can be used in terms of absolute or relative loads (percentage of body weight). The protocol presented here is based on using four different relative loads in a bilateral broad jump. Unilateral jumps can certainly be used. Each jump is performed at maximal effort utilizing the No Fly Weight resistance mode with the concentric speed limit set to maximum 14 m/s. The concentric and eccentric load was equal with eccentric speed limit set to .7 m/s to prevent the system from pulling back quickly after completing the landing phase. Each loaded jump trial is performed with sufficient rest between jumps beginning with the lightest load. Outcome measurements are force, speed, and power. Average peak velocity from each loaded condition can be plotted against load to generate a load-velocity profile
How it Works
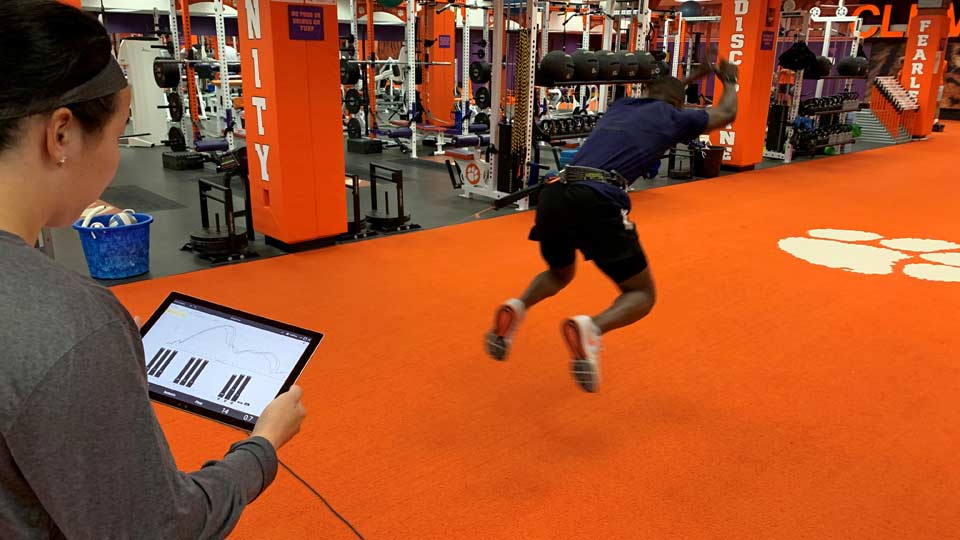
Video 1. Two-leg broad jump performed by Clemson University Strength & Conditioning Intern (and former NCAA triple-jumper) Gralyn Jones.
Our athlete in the demo video, Gralyn Jones, weighs 83 kilograms (183 lbs) with the result of four different jump trials presented in Figure 1 below. Four jumps were performed at each of the four loads. To obtain a robust measurement, the average speed for each load was calculated after deleting the jump with the highest and lowest value.
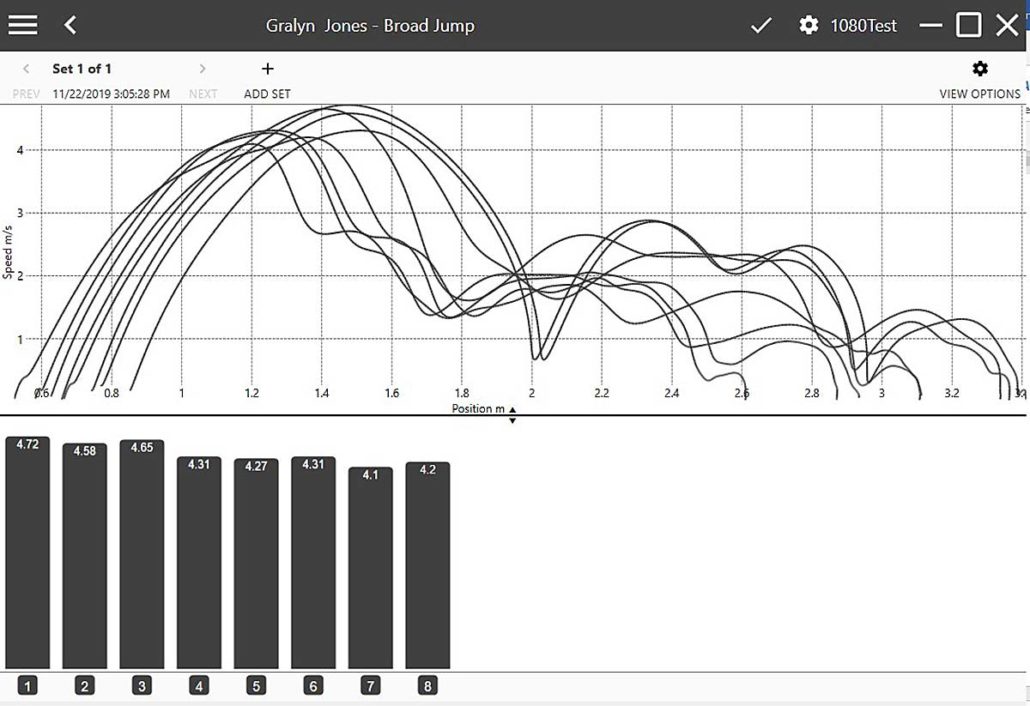
In Table 1 below, the average peak speed measured during each of the four jump trials is presented. Please note that other outcome measurements can also be used, but speed is an easy variable to test and monitor. As expected, an increased external load will decrease average peak speed. The 1080 application will then take the average of the two peak speed measurements for each loaded condition to generate a Load – Velocity profile (Figure 2).
The load velocity profile is an inverse linear relationship between external load and average peak speed. The linearity of the relationship is expressed by the coefficient of determination (R2), where a value of 1.00 is perfect. The observed value (R2 = 0.972) indicates a high linear relationship. Interpretation of such values will vary depending on the number of data points included and type of data. For the purposes of the load-velocity relationship, as presented here, a value greater than 0.9 is considered good. Smaller values will impact the reliability of the slope, as well as the x- and y-axis intercepts. Specifically, the x-axis intercept is the theoretical maximum load (L0), while the y-axis intercept is the theoretical maximum speed (v0).
The load-velocity profile can be useful for a number of reasons, relating to how different athletes perform the task and how responses to load are presented. Thus, x- and y axis intercepts with the slope provide information to make interpretations about speed and strength capacity, which can then be used for training program prescription. Furthermore, the load-velocity profile can be used to monitor performance and training progress. The ability to perform both horizontal and vertical (using 1080 Quantum) load-velocity profiles is important, as the ability to generate vertical and horizontal speed are different physical qualities.
| Percentage of Body Weight [83 kg] | Load [kg] | Average Velocity [m/s] |
| 2.5% | 2.1 | 4.65 |
| 5.0% | 4.2 | 4.48 |
| 10.0% | 8.3 | 4.29 |
| 15.0% | 12.5 | 4.15 |
Table 1: Progressive loading of body weight leading to expected decrease in max velocity at each load. This is consistent with inverse relationship expected with a load-velocity correlation.
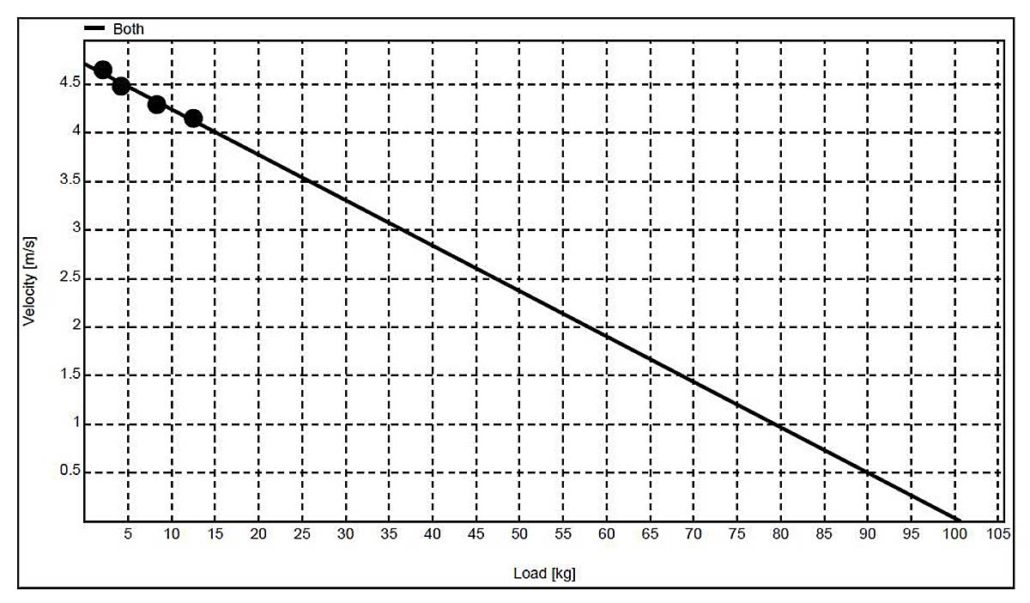
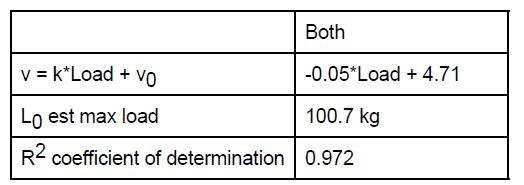
Figure 2: 1080 Sprint load velocity report displayed with four trials of resisted, two-leg broad jump. Peak velocity indicated to be 4.71 m/s with high R2 of 97%.
When performing testing with 1080 Sprint:
• First mark out a consistent starting location for each jump to ensure reproducibility (a distance of about 4 meters out from the Sprint system will ensure the angle of the line up to the athlete’s waist belt is not too sharp).
• A sub-max effort jump prior to testing to feel each load may benefit the athlete to orient to loaded jumps and provide maximum effort during testing.
• Full effort of each measured jump is required to reliably calculate peak velocity at bodyweight.
Following the testing of the individual, the report can be viewed, emailed, and printed.
In summary, the 1080 Sprint provides the ability to measure peak velocity of horizontal movements in a systematic order. The opportunities to utilize the data to monitor training adaptation can be completed within a short testing session.
References
Reiser R.F., Rocheford E.C., Armstrong C.J. (2006) Building a better understanding of basic mechanical principles through analysis of the vertical jump. Strength & Conditioning Journal 28(4), 70-80 [Google Scholar]