
Webapp Update
The following improvements are introduced in WebApp Comparison Report Tool
When logging in at webapp.1080motion.com, you can select a report called “Compare over time.” It will allow you to follow the progression of a particular exercise over time for one or several Clients or compare a group of Clients during one session (e.g., 30m sprints).
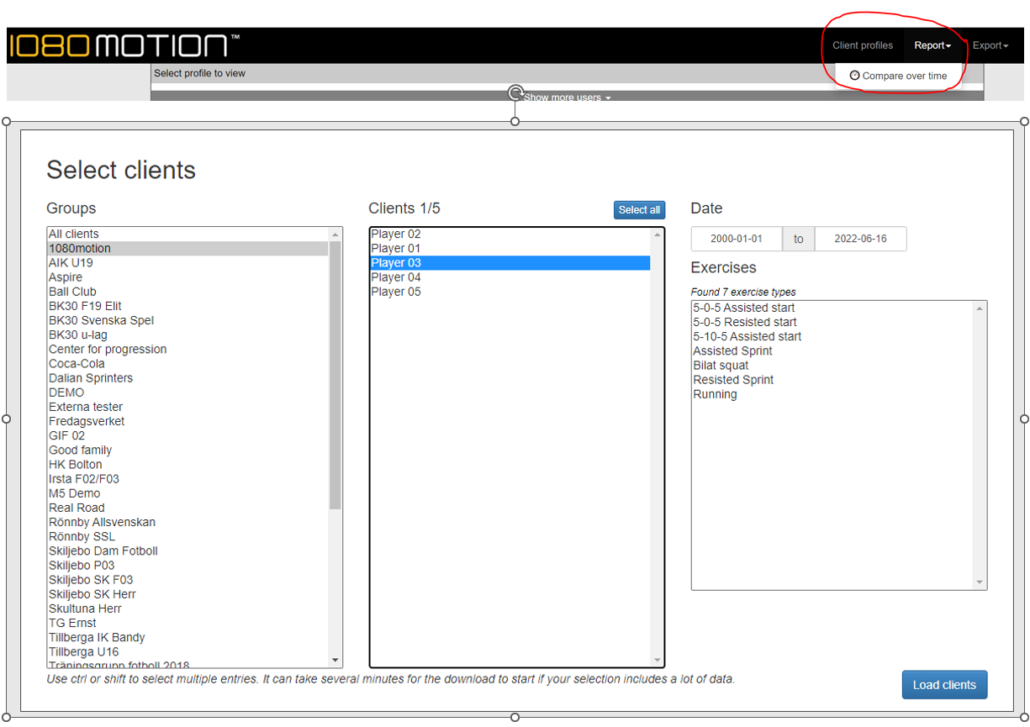
The first step is selecting a client or multiple clients to compare. Selection always includes filtering Group, Client, Date, and the specific exercise type.
Three available types are listed when selecting the exercise: Reps, Linear, or CoD.
- Reps are unilateral or bilateral repetitions collected as single, Syncro and Syncro-Smith (e.g., Single-arm row or broad jump)
- Linear is a linear exercise type (e.g., Sprinting)
- CoD is a change of direction exercise type (e.g., Assisted 5-0-5)
A. REPS
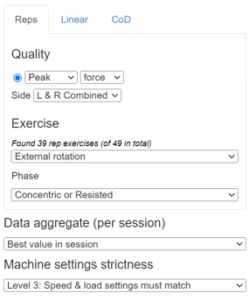
- Quality – Select Peak or Average for either Force, Power or Speed
- Side – For bilateral exercises, select to show Left/Right side combined or L and R side separate
- Exercise – Select data from the specified exercise
- Phase – Select data from the concentric-resisted or eccentric-assisted phase
- Data aggregate (per session)
- Best value in session (i.e. best rep)
- Best set average in session NOTE: Before reporting, please remove or clean “bad or unwanted reps” in any sets
- Average of set averages NOTE: Meaningful data requires total effort. Again, please remove or clean “bad or unwanted reps” before running the report.
- Machine setting strictness
- Level 1: Load and speed settings can differ
- Level 2: Load must match but speed setting can differ
- Level 3: Speed and load settings must match
IMPORTANT!
Machine settings strictness is essential – you want to compare apples to apples! The software will look at the first session chosen by date, and those load and speed settings will then govern the following sessions/sets – they must have the same load and speed settings as the first to be included in the report.
Sometimes machine setting strictness is not important. For example, speed settings don’t come into play when performing traditional power exercises where you want to follow progression power (Watts) in the concentric phase. In this case, it does not influence the report if different speeds are used during other exercise sessions. Therefore, choosing level 2 (6b) is sufficient.
Furthermore, suppose you want to follow the progression of power and see the Client clearly improving over time; you may wish to increase loads between exercise sessions to maximize the power produced – then selecting Level 1 (6a) is your best choice in this instance.
B. LINEAR
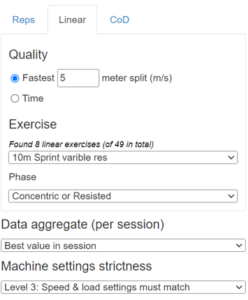
- Quality – Fastest X meter split or fastest time
- Exercise –select data from the specified exercise
- Phase – select data from phases, concentric-resisted or eccentric-assisted
Data aggregation and machine settings strictness as for REPS (See section A. Reps).
C. CHANGE OF DIRECTION
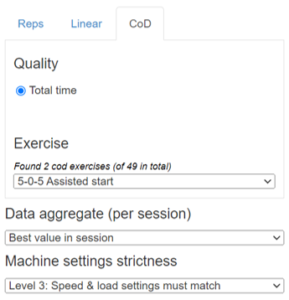
- Quality – Only total time available, no phase times
- Exercise –select data from the specified exercise
Data aggregation and machine settings strictness as for REPS (See section A. Reps).
REPORTS
After selections are made, press ”Generate report.”
For a report of one specified date, a bar graph is generated
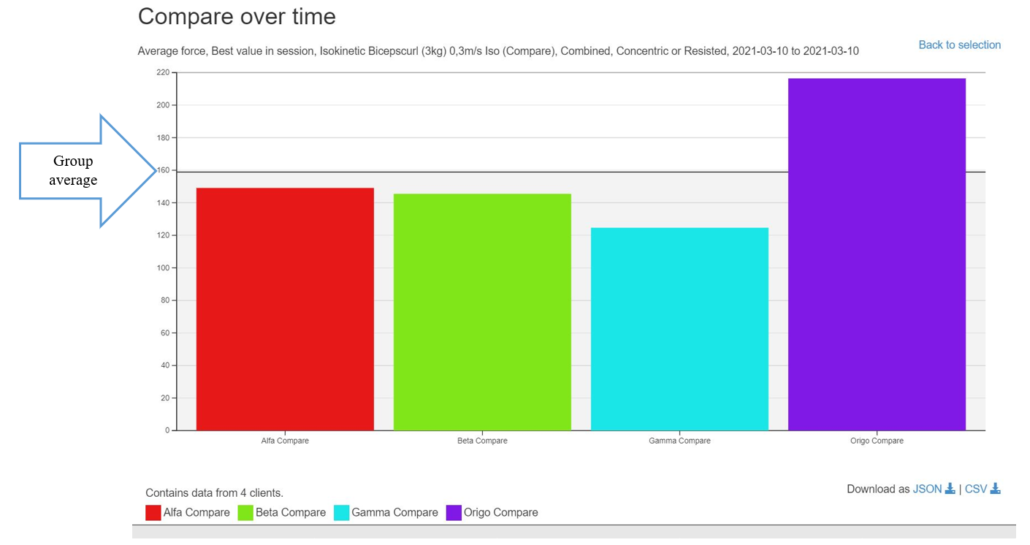
-Report of a specified date, a bar graph is generated.
-The black line represents the group average value.
-If you press Download as JSON, this exports the data in JSON format.
-If you press Download as CSV, this exports (all if more than one per Client) data entries for the selected settings and time interval in CSV format.
2 Report for comparison over time
For sessions with two or more entries, a line diagram is generated.
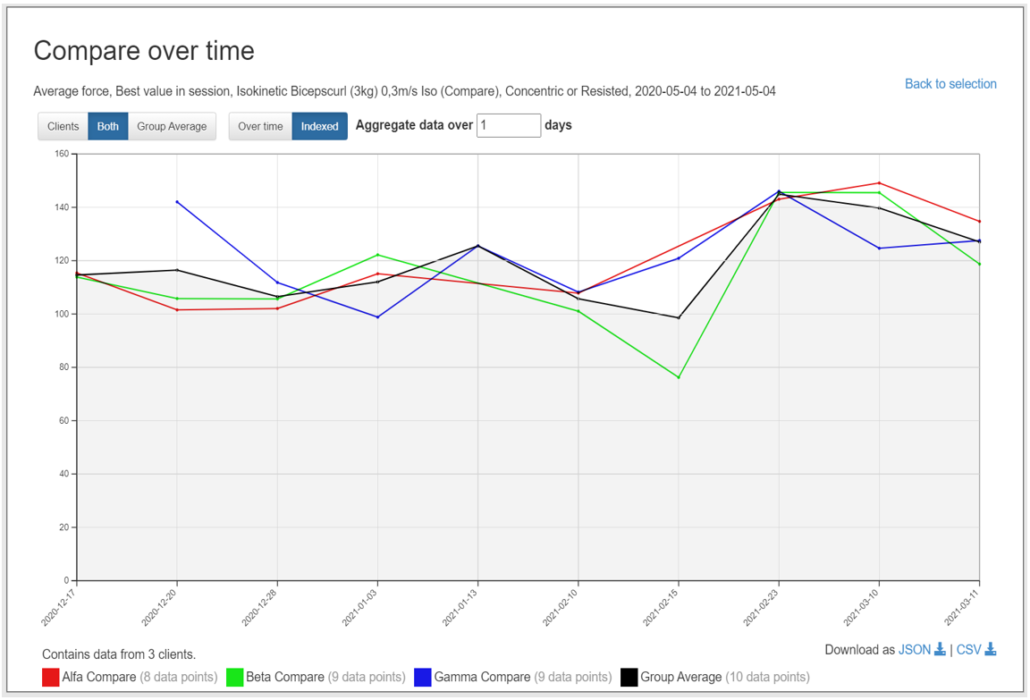
The black line represents the group average value.
Over time: The curve is shown over time.
Indexed: The curve is shown uniformly over the graph. It uses the aggregate data duration.
Aggregate data over X days: The maximum number of days sessions can be shown in the graph and considered to have occurred at the same time/session. (E.g., In a team setting, one group tests on Saturday and the other group tests on Sunday – choosing aggregate data over two days displays the data as if it happened on the same test day.
PRO TIPS
- Finding relevant historical data will likely be challenging unless you have done this “by hand” before. For example, the chosen settings and length recorded during a run need to be consistent for meaningful comparison.
- Moving forward with this tool, we advise users to select a few exercises with a strict settings protocol for load, speed, and execution. Strict setting protocols create meaningful reports to compare recorded data.
- Standardization procedures should be considered, and permanently delete unwanted or “bad” reps to compare the set average.
- Finally, we suggest users create specific exercises and name them to easily find them in the selection tool, as we did in the example above using “(Compare)” in the name.
TESTIMONIALS
SOME OF OUR CUSTOMERS


Follow on Instagram


1080 Motion is a Swedish company serving clients worldwide. Our groundbreaking technology is the product of a unique mix of expertise in sports physiology and advanced control systems.
Latest News
 Frozen Fury: Unleashing the Power of Michigan State HockeyApril 16, 2024 - 9:05 am
In the world of sports, few spectacles match the fast-paced intensity and exhilaration of ice hockey that requires unparalleled athleticism, […]
- NFL Combine Training: Insight from Ryan CaprettaFebruary 29, 2024 - 1:15 pm
It’s that time of year again – “combine season”. The annual NFL Scouting Combine and Pro Days. The road to […]
- Year-Round College Football Training with the 1080 Sprint: An Interview with Director of Speed Development John ShawFebruary 28, 2024 - 4:02 pm
About John Shaw: John is currently the Director of Speed Development for the University of Washington football team. Previously, he […]