Special guest post from 1080 Speed Clinic New York speaker Chris Korfist. Learn more about attending here.
I have been sitting on the top of a 1080 Sprint for almost a decade, watching people run away from me as I record data. I have had young, old, fast, slow, big and small. The people at 1080 have said that I have recorded more sessions than anyone else (it helps that I have had it the longest in North America). I am finally in a space where I can generalize about where you need to be and what you need to do to be fast.
Caveat: this is not a scientific study. This is a US History teacher looking at graphs and charts. I am not a statistician. I understand there is noise in the data, and some scientists will argue that. I am just looking at graphs and making some generalizations. That is one of the first problems I see when we look at a graph. We smooth the speed curve on the 1080 Control app and other research we have seen. When we smooth the curve, it seems like everyone is pretty even in the beginning, but it is at the top-end speed that we start to see a difference.
Here, we see from Ken Clark’s classic research on the 40-yard dash at the NFL combine that everyone accelerates at about the same speed, and max velocity starts to separate the various athletes at the combine. What is misleading for the average high school coach is that we think everyone accelerates at about the same speed and we should focus on maximum velocity. It is true that most elite athletes accelerate and hit certain marks; for example, regardless of size, they mostly all peak at a minimum of 3.0 m/s on the first step, 4.0 m/s on the second step, and get to 6.0 m/s, roughly about the same pace.
Figure 1: A) Graph of velocity vs. distance for the slowest athlete at the NFL combine, athletes representing the 20th, 40th, 60th, and 80th percentile, and the fastest athlete at the combine. These 6 athletes displayed appreciably different v max and overall 36.6 m sprint performance. B) Graph of % v max vs. distance for the same 6 athletes. The overlapping curves between subjects indicate similar τ values, demonstrating that these athletes of vastly different sprinting capabilities accelerated in a comparable pattern relative to v max. (Posted with permission by Author) Full text https://tinyurl.com/bdewu28a
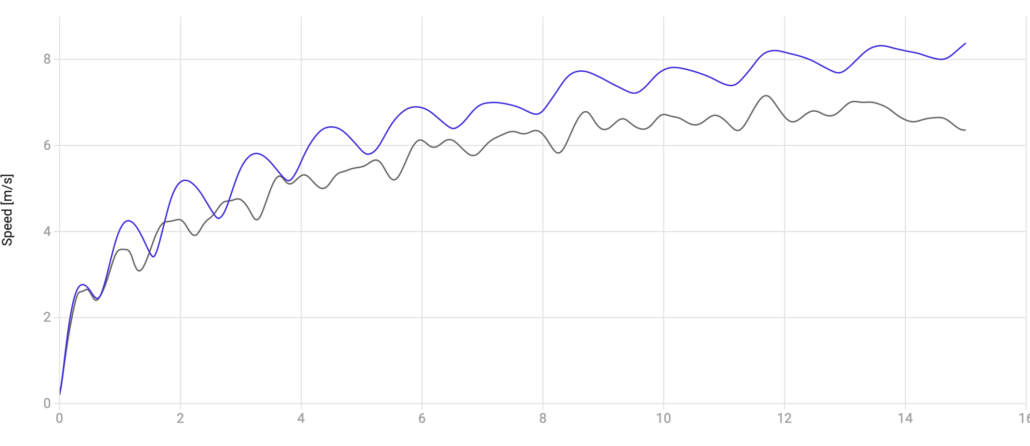
But now, let’s look at two high school athletes, one elite (Racer M Blue Curve) and one good (Racer B Orange Curve).
From a smooth curve, they don’t look that different.
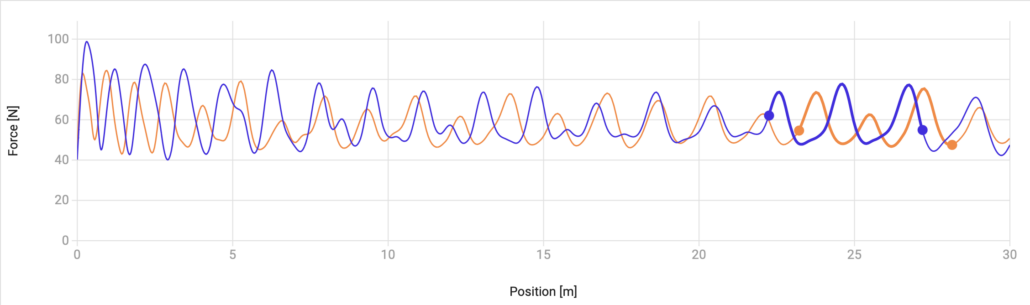
However, when we look at the raw data, we see that it is very different.
The first peak on the 1080 data is my first marker. We see a different race when we see the “rough” data that hasn’t been smoothed out. Racer M hits a peak velocity of roughly 3.15 m/s at .53m compared to Racer B, who is at 2.26 m/s at .39m. So by the first step, Racer M is 2.2 mph faster than Racer B and .15 m further ahead. Technical aside, I used 3kg of tension to limit the attachment’s side-to-side movement.
If you cannot make 3.0m/s at that first peak, you have considerably lowered your ceiling in how fast you run. I have yet to see someone ” fast ” who doesn’t hit that mark.
People who miss that mark usually don’t project out as far or take a false step. You can now understand that when someone says they are a step slow, that is literally a fact.
An interesting point is that your really explosive athletes can keep that 3.0 velocity to as much as a 10-12 kg resistance from the 1080. Athletes who lack the power but are fast usually have a pretty fast decrement in speed when there is resistance. Average athletes have a pretty symmetrical decrement with added resistance.
How do we get more athletes to 3.0 m/s? Horizontal force. Generally speaking, someone who hits the 3.0 m/s mark can generate about 8 N/kg of force horizontally. Where it gets confusing, using traditional weightlifting lore, big weight room numbers do not convert to big N/kg. Regarding the force output between Racer M and B, Racer M has a huge force output generated against the 1080 Sprint but is much weaker in the weight room with traditional exercises. Racer B is a big weight room numbers guy. He even has the shirts to prove it. I have observed big squatters, 500lbs +, only generate 6 N/kg against the 1080 Sprint at 3 kg resistance.
My guess is that applying force in the right direction is one main reason why we have this difference. When lifting weights, we get strong at pushing up, not forward. I think we get good at pushing against a bar vertically rather than pushing our body forward against the ground as quickly as possible. So, exercises like reverse leg presses or kickbacks can be very useful. Matt Neal’s creation is ingenious in dealing with this scenario (See Video).
View this post on Instagram
Of course a properly set 1080 Sprint or Quantum using proper foot mechanics is the best solution.
The second problem is that athletes lack the ankle strength to hold the position needed to push horizontally. When the athlete’s foot hits the ground, the shin/knee has to rotate forward and then push. If the athlete cannot keep that angle, the ankle will give, resulting in the heel dropping to the ground. Once the heel drops, the shin loses its forward rotation, resulting in a more vertical push.
How can we strengthen our ankles to hold? In the weight room, all the pushing we usually do has our entire foot on the ground. If the heel is on the ground and the foot is under our hip, the foot doesn’t need to take up tension. What if we raised our heel as high as possible and did some traditional movements, like step-ups or squats? That would change the entire dynamic of their movement. The limiting factor now becomes the foot.
Video: Trail vertical box jump with an elevated heel.
This can be done off the Sprint or Quantum. This athlete has a 42” jump. To cut his speed in half on required 13 kg or resistance.
Or, we can just focus on the first step. The back leg pushes hard enough to push the front knee down and then a push. If I am sitting on the back of the Sprint, I should see the bottom of his shoes the whole time. You can see on this athlete there is a moment of give when his hip is slightly in front of his foot. His heel drops.
To deal with this issue, I would put him on a box and jump vertically while trying to keep his heel high. Again, not a lot of resistance so this can be easy done with a Sprint or Quantum.
This is a good starting point for determining the appropriate numbers. Next, we will consider some ideas for increasing power.
- Chris Korfist, Co-owner of Track Football Consortium and Owner of “Slow Guy Speed School” is a featured speaker at 1080 Speed Clinic: New York on Oct 12, 2024. Click here to learn more about attending this event for all coaches, clinicians and persons interested in improving human performance.